







Estimated reading time at 200 wpm: 13 minutes
WordPress powers a huge proportion of the web. It is flexible, extensible, and widely understood. It is also capable of becoming remarkably slow without any single obvious cause.
Whether or not you agree our Fat Disclaimer applies
Performance optimisation is the process of reducing the time it takes your server to respond to a request and deliver a page to a visitor. Done well, it makes your site feel immediate. Pages load before the visitor notices they were waiting. The editor saves without hesitation. Everything just works.
Done badly — or not done at all — the consequences accumulate quietly. Pages take three seconds to load. The block editor throws cryptic errors. Visitors leave. Search engines take note. The site feels like it is wading through treacle, and you cannot quite identify why.
The good news is that meaningful optimisation does not require a developer, a new hosting plan, or a complete rebuild. The interventions described here are available to any WordPress site owner with access to cPanel and the WordPress dashboard. Several of them are free. Most take under ten minutes. And the results are measurable in real numbers before and after each change.
If nothing else, just installing and configuring LiteSpeed Plugin can bring up to a 30-fold fold improvement in site performance. Sites with loads of plugins may see less and require deeper attention showed in this article.
This is not a theoretical overview. Everything here was tested on real sites, with real numbers recorded at each stage.
Start With a Baseline, Not a Theory
Before changing anything, measure the current state of your site.
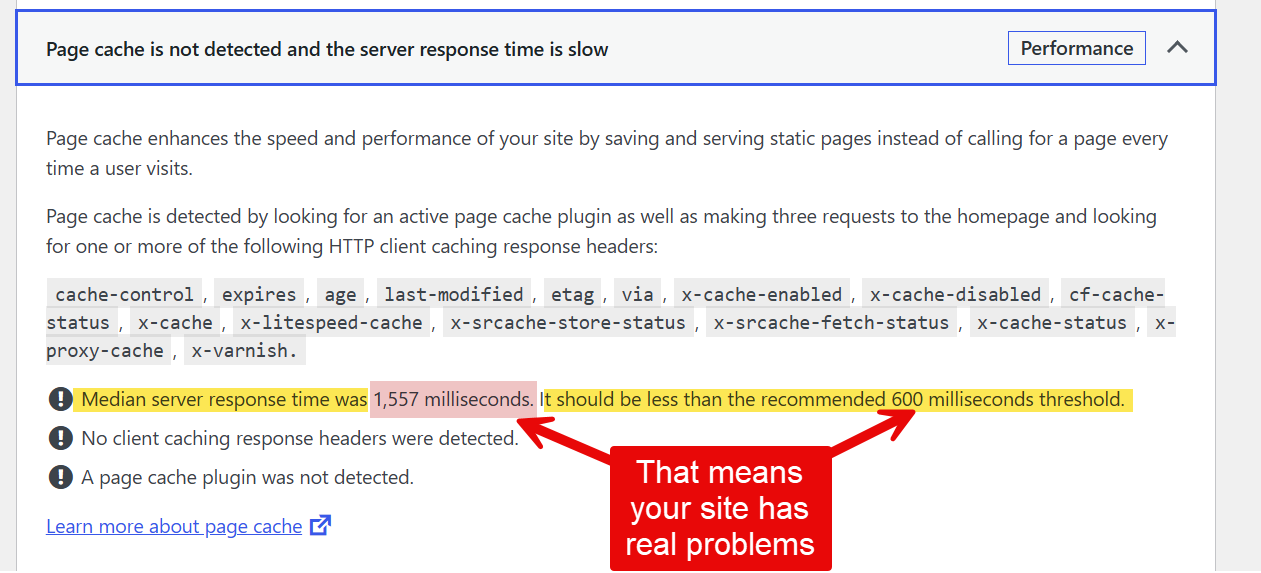
WordPress provides a built-in tool for this. Go to Tools → Site Health in your dashboard and look at the Performance section. The key figure is the median server response time. This is the time it takes your server to process a request and begin sending a response. WordPress recommends staying under 600 milliseconds.
Write that number down. It is your starting point. Without it, you cannot know whether any subsequent change made a difference.
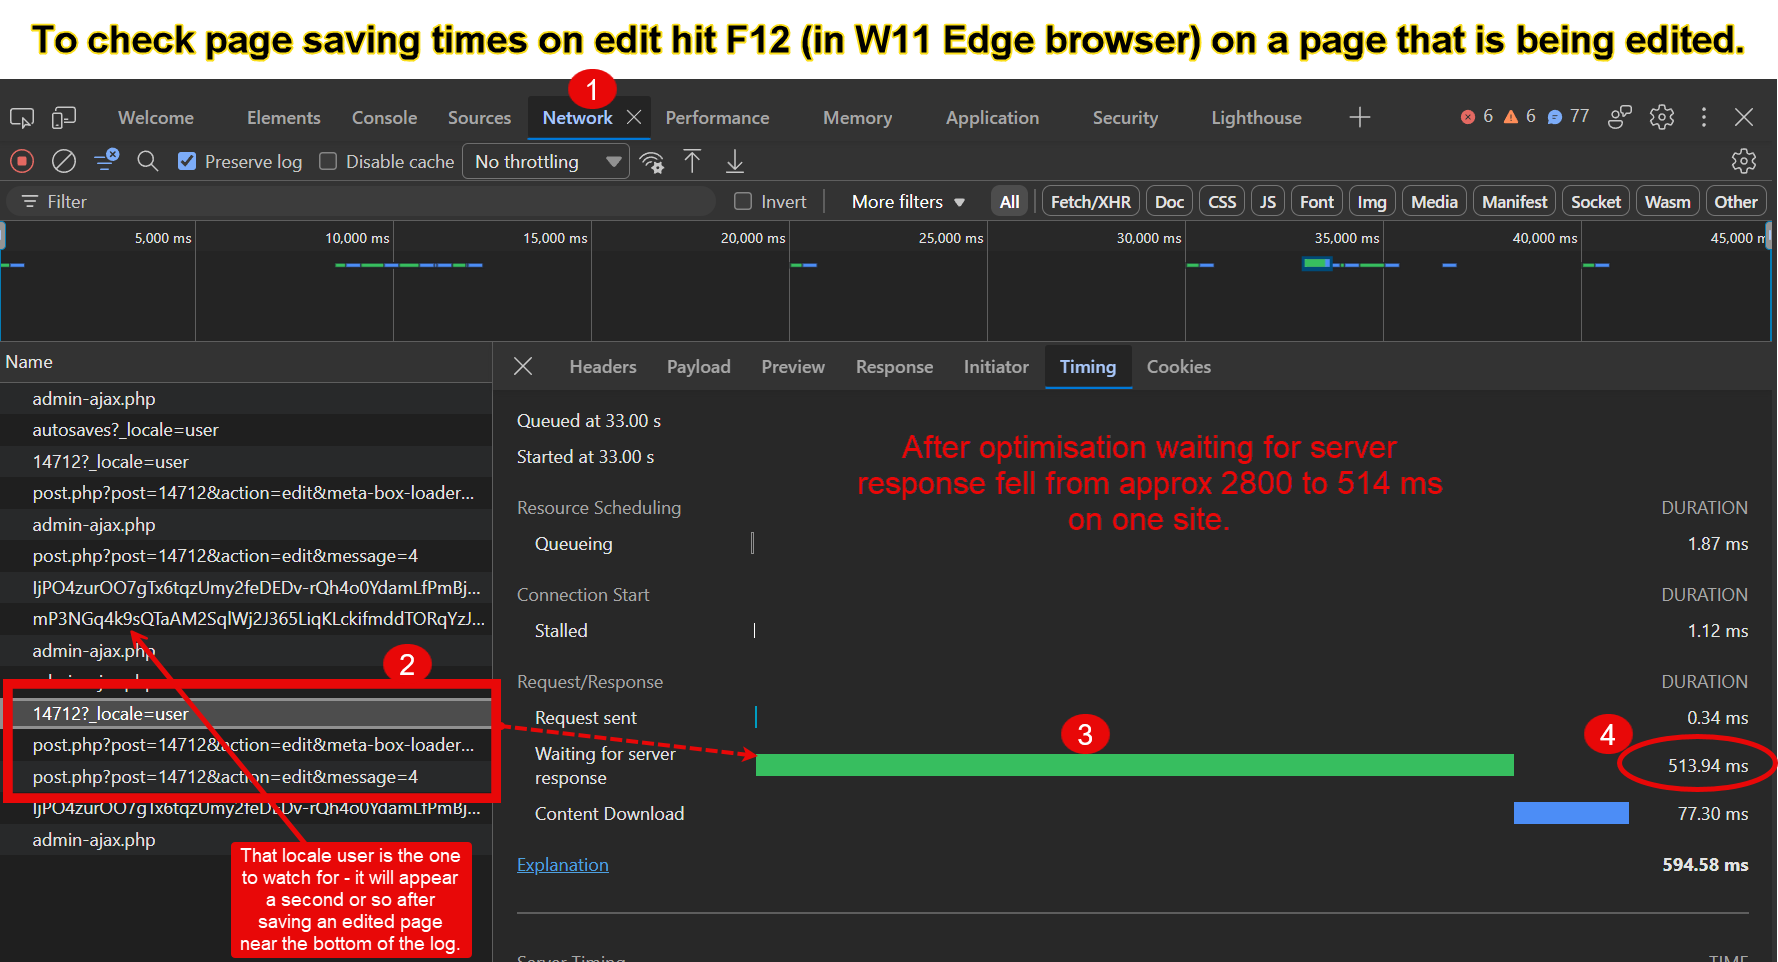
The second useful measurement is the Gutenberg save time — the time the editor takes to save a post to the server. Open a post, make a small edit, click Update, then open your browser’s developer tools (F12), go to the Network tab, filter by wp-json, click the resulting entry, and read the Waiting for server response figure under Timing. Write that down too.
These two numbers — site response and save time — are your benchmarks. Return to them after each intervention. Numbers do not lie, and they prevent you from spending time on changes that are not actually helping.
The Diagnostic Tool that could be the problem
WP_DEBUG is a WordPress setting that enables error logging. It is genuinely useful when something is broken and you need to understand why. It writes PHP errors, warnings and notices to a log file on your server.
The problem is that many site owners enable it during a period of troubleshooting and never turn it off. The setting sits quietly in wp-config.php, writing to the log file on every single request — every page load, every editor save, every admin action.
Writing to disk on every request is not free. On a busy or plugin-heavy site the cost can be substantial. In testing on a CaptainsWatch, disabling WP_DEBUG alone reduced the median server response time from over 1,200 milliseconds to 691 milliseconds.
To check whether WP_DEBUG is enabled, open your site’s wp-config.php file in cPanel File Manager. Search for WP_DEBUG. If it reads:
define('WP_DEBUG', true);change true to false and save the file. Also set WP_DEBUG_LOG and WP_DEBUG_DISPLAY to false if they appear.
Check your site health figure immediately afterwards. The improvement, if WP_DEBUG was on, will be immediate and visible.
PHP Version Matters
PHP is the programming language WordPress runs on. Your hosting provider typically offers several versions, and you can switch between them in cPanel under PHP Version or MultiPHP Manager.
Newer versions of PHP are meaningfully faster than older ones. PHP 8.5 processes code more efficiently than PHP 8.2, which is already considerably faster than PHP 7.x. The performance difference is not marginal — it is measurable on every request.
Before upgrading, check that your active plugins and theme declare compatibility with the version you intend to use. Most reputable plugins have supported PHP 8.x for some time. The WordPress admin will flag any known incompatibilities.
The upgrade itself takes seconds. The gain is permanent and requires no ongoing maintenance.
OPcache — Free Performance Already on Your Server
Every time a visitor loads a page, PHP has to read and compile the WordPress core files, your theme files, and every active plugin file. On a site with thirty or more plugins, that is a significant amount of work repeated on every request.
OPcache eliminates this repetition. It compiles PHP scripts once and stores the result in memory. Subsequent requests use the stored version rather than recompiling from scratch. The server does less work on every request, and the saving compounds across every plugin and every page load.
OPcache is available on most shared hosting accounts and is enabled in cPanel under PHP Extensions or the PHP settings panel. Look for opcache in the list of extensions and enable it. No further configuration is required for a standard WordPress installation.
Redis Object Cache — Database Queries From Memory
WordPress makes repeated database queries to build each page. The navigation menu, the widget settings, the post content, the user data — all of it requires database reads. Many of these queries retrieve the same data on every request.
Redis is an in-memory data store. The Redis Object Cache plugin for WordPress connects to a Redis server and stores the results of database queries in memory. When the same query runs again, Redis returns the stored result without touching the database. The database gets a fraction of its previous workload and the server responds faster.
Many shared hosting providers now include Redis as part of their standard offering. On Krystal hosting, Redis can be enabled via the Redis Manager in cPanel. The connection may use a Unix socket rather than the standard TCP port — if the Redis Object Cache plugin reports the server as unreachable, check cPanel for the socket path and add these lines to wp-config.php just above /* That's all, stop editing! Happy publishing. */:
define('WP_REDIS_SCHEME', 'unix');
define('WP_REDIS_PATH', '/var/kredis/youraccount/redis.sock');
Replace the path with the one shown in your cPanel Redis Manager.
Once connected, click Enable Object Cache in the plugin settings. The gain is visible immediately in the plugin’s metrics graph as the cache warms up.
LiteSpeed Cache — The Native Fit
If your hosting provider runs LiteSpeed Web Server, the LiteSpeed Cache plugin is the natural choice for page caching. It’s available for free by searching from the plugins section of WP dashboard.
Page caching takes the fully rendered HTML of a page and stores it. When the next visitor requests that page, the server returns the stored HTML directly, bypassing PHP and the database entirely. The result is response times measured in tens of milliseconds rather than hundreds.
One configuration step is essential before activating caching. Go to LiteSpeed Cache → Settings → Excludes and add the following to the Do Not Cache URIs field. Insert this ?s= and save.
This tells LiteSpeed Cache never to cache search results pages. Search results are dynamic — they depend on what the visitor searched for — and serving a cached search result to the wrong visitor produces errors. With this exclusion in place, search works correctly.
After activating the plugin, check Site Health. The performance section should report a detected page cache and a server response time well under the 600 millisecond threshold.
The Redundant Plugin Problem
Plugins that are activated but doing nothing still load on every request. Each one adds a small overhead — registering hooks, loading files, checking settings. Individually the cost is minor. Collectively, across a plugin list that has grown over years, it adds up.
The most common source of redundant plugins is not negligence. It is change. A plugin is installed to connect WordPress to an external service. The service is later managed directly through its own dashboard. The plugin remains activated because there is no obvious prompt to remove it.
The Cloudflare plugin is a frequent example. Many site owners manage Cloudflare entirely through the Cloudflare dashboard, making the WordPress plugin unnecessary. If the plugin’s settings page shows a signup screen rather than a connected account, it is doing nothing and can be deactivated.
Audit your plugin list periodically. For each active plugin, ask one question: what would break if I deactivated this? If the answer is nothing, deactivate it.
Measuring the Result
After each intervention, return to Tools → Site Health and read the median server response time. Also run a Gutenberg save timing as described at the start. Record both figures.
The 600 millisecond threshold in Site Health is a guideline, not a hard limit. A site consistently under 300 milliseconds is performing well.
The figures tell you what each change actually cost or saved. They keep the process honest and prevent time being spent on interventions that sound plausible but produce nothing measurable.
Performance optimisation is not a one-time event. Plugin updates, new content, and changing traffic patterns all affect response times over time. Check Site Health occasionally and repeat the process if figures drift upward. The interventions described here remain valid across repeated application.
A fast site is not a luxury. It is what visitors expect, what search engines reward, and what makes the experience of running and writing for a WordPress site considerably more pleasant. The tools to achieve it are available, they are mostly free, and the results are immediate.
Real Results — What Each Fix Actually Delivered
The figures below are not estimates. They were measured on a live WordPress site running thirty-four active plugins on shared LiteSpeed hosting, behind Cloudflare, using the methods described throughout this article. Each intervention was applied in sequence and measured before the next change was made.
Two measurements were tracked separately throughout. Site Health median server response reflects the overall server processing time under normal load. Gutenberg save time reflects the write path specifically — how long the editor takes to save a post to the server. Both matter, and they do not always move together.
Site Health — Median Server Response Time
| Stage | Intervention | Median Server Response |
|---|---|---|
| Starting point | No changes — WP_DEBUG on throughout | 1,200–1,567 ms |
| Fix 1 | WP_DEBUG set to false in wp-config.php | 691 ms |
| Fix 2 | PHP upgraded from 8.2 to 8.5; OPcache enabled | 570 ms |
| Fix 3 | Redis Object Cache connected via Unix socket | 456 ms |
| Fix 4 | LiteSpeed Cache installed with search exclusion | 63 ms |
The drop from Fix 1 alone — from over 1,200 ms to 691 ms from a single line change — was the most significant single intervention. Everything after that built on a site that had already recovered from its primary pathology.
The final figure of 63 ms represents a site with active page caching returning a cached response. At this level the x-litespeed-cache header is present and Site Health reports the page cache as detected and passing. The same intervention applied to a second site, investigativepsychiatry.com, produced a comparable result of 69 ms.
But wait – as caches settle down expect further overall reductions e.g. at 2026-08-16 15:40 I’m seeing figures like 52 ms. Just sweet!
Not everyone has 34 plugins on their site. On one site where I have only 6 plugins LiteSpeed alone – nothing else – achieved a reduction from 620 ms to 3 ms. That’s over 200 fold improvement! Redis actually slowed that down.
A note on Redis
When you added Redis, the Site Health test catches the site in a partially uncached state. Site Health deliberately makes multiple fresh requests, sometimes bypassing the page cache to measure true server response time. At that point Redis adds its own small overhead — connecting to the socket, checking the cache — on top of the base PHP execution. On a six-plugin site with minimal database load, that overhead is proportionally more visible than the saving. Redis is designed to accelerate database-heavy sites. On a six-plugin site already running at 3–20 ms with LiteSpeed Cache, there is essentially no database load to accelerate. Redis has nothing meaningful to do and adds a small connection cost instead.
Gutenberg Save Time — Waiting for Server Response
| Stage | Intervention | Save Time |
|---|---|---|
| Starting point | No changes — WP_DEBUG on | 2,350–2,800 ms |
| After Fix 1 | WP_DEBUG set to false | 376–379 ms (these times may fluctuate). |
Only two data points exist for save time because the dramatic improvement after Fix 1 made further staged measurement less informative. The save time dropped from approximately 2,600 ms to under 380 ms — a reduction of over 85 percent — from disabling debug logging alone.
Subsequent fixes (PHP 8.5, OPcache, Redis, LiteSpeed Cache) primarily benefit front-end page delivery and database read operations. Their effect on the Gutenberg write path is present but smaller.
What the Numbers Mean in Practice
Before these interventions, the site was operating at roughly four times the recommended server response threshold. The Gutenberg editor was taking nearly three seconds per save. Occasional save failures were producing a “not a valid JSON response” error in the editor.
After these interventions, the site operates at roughly one tenth of the recommended threshold. The editor saves in under 400 milliseconds. No further errors have been observed.
The total time spent on the interventions themselves — not the investigation that preceded them, but the actual fixes — was a single afternoon.
Conclusion
WordPress performance problems rarely announce themselves clearly. They accumulate gradually — a slower save here, a slightly longer page load there — until the site feels unreliable without any obvious single cause.
The interventions described in this article are not exotic. They do not require specialist knowledge or significant expense. PHP 8.3 and OPcache are available in cPanel on most shared hosting accounts. Redis is increasingly included as standard.
LiteSpeed Cache is free. Disabling WP_DEBUG costs nothing except the willingness to open a configuration file.
What they require is a methodical approach. Measure first. Change one thing. Measure again. The numbers guide the next step. Without measurement, optimisation becomes guesswork, and guesswork wastes time on changes that sound
plausible but deliver nothing.
The results demonstrated here — from 1,567 ms to 63 ms on a mature, plugin-heavy site — were achieved using only the tools described. No extra costs were involved.
A well-optimised WordPress site is a joy for webmasters, hosting providers and users. Pages arrive before visitors notice they were waiting. Errors stop appearing without explanation. That quiet reliability is entirely achievable, and the path to it
is more straightforward than most site owners may imagine.